2010年12月8日 星期三

聖誕節氣氛十足

話說現在住的鄰居真的很熱愛裝潢
上次布置了嚇人的鬼怪襯托萬聖節就算了
這兩天看到他們竟然布置好了聖誕節!!
一整個就是很有聖誕氣氛

一個大大的聖誕老人以及雪人在雪地中還有許多的燈光配置
讓人更感受到聖誕節的氣氛


不免俗的還是要入鏡一下...聖誕老公公真的好大一個喔
乾脆我們家門口放幾隻麋鹿跟禮物好了…


雪人竟然跟我一樣大XD

2010年12月6日 星期一

[學習] MATLAB polynomial regression

其實這也不是多複雜的功能
不過這次作業用到的關係
把這個指令稍微瞭解了一點
在這邊整理一下
[p,S,mu] = polyfit(x,y,n)
x 指的是預測變數值 independent variable
y 是被預測變數 dependent variable
n 是指polynomial 到的指數次方…{1,2,…}

得到的
p 是係數
S 是一些output例如df ss的值
mu 是標準化相關的值

此外還可以利用polyval得到預測值
pre_y = polyval(p,x)

差距的誤差: dif = y-pre_y

參考連結:
1. http://www.mathworks.com/help/techdoc/ref/polyfit.html
2. http://www.mathworks.com/help/techdoc/ref/polyval.html

2010年12月1日 星期三

Happy Thanksgiving

這一次的感恩節真的過得比較輕鬆了一點
其實實際上面並沒有太多的不同
還是一堆的作業跟事情要趕
但是今年我們稍微有去Outlet買一些東西
也跟幾個朋友聚餐吃吃東西… 玩了board game

不過假期真的很快就過去了
轉眼間又要面對學期的結束
還有相對應的作業跟計劃報告
看來接下來兩個星期要皮繃緊一點
才能夠順利的過完這學期

KC

2010年10月7日 星期四

[心情] 忙碌的感覺

出國之後
真的很深刻體會到什麼叫做時間不夠用
有時候想想時間真的過得很快
一下子就又過了一個月了

而且似乎是普遍上的狀況
很少聽到有人可以輕鬆的過日子
又同時能夠做出很多事情的

其實也不會特別討厭這樣忙碌的感覺
不過希望自己最後可以習慣這樣的生活就好了

PS: 我的遊記不知道什麼時候可以開始第一天 XD

--
After studying in US, I finally realized that what is called a tight schedule. It seems that after one blink, one month had passed. Especially it's pretty normal within the PhD students. I hope I would get used to it eventually(soon?) so that I can manage my time better and start the writing of the first day of my journey to Florida.

2010年7月9日 星期五

[遊記] Trip to Florida - 前記

話說這一次去佛羅里達(Florida)並不是規劃許久的
剛好 Pon 的老闆不在,他比較方便一起玩
加上考完Prelim之後一直想要去哪裡散散心..
又看到了漂亮的機票價格..就毅然決然的決定下去..
對於一個不是熱衷於旅遊的我
這樣的決定其實還滿突然跟令我自己訝異的..

當買下機票後開始查相關的旅遊資訊..
忽然發現那邊的天氣跟台灣的不相上下
我又沒帶什麼短袖的衣服褲子..就開始擔心中
不過因為Florida是一個觀光景點盛行的地方
能夠玩的點真的滿多的..
加上稅也比我們這邊便宜很多..
對於住宿或旅遊上面就沒有太擔心
跟老闆確定一下時間上面ok後
就沒有去想它太多了

到了去的前一兩個星期..跟 Pon 規劃一下
滿感謝Pon的建議跟大力幫助..
讓旅遊的行程從原本的主題樂園週到南北縱貫的公路旅行..
到最後的北中部旅遊之行.. 漸漸變得合理也不會太勞累
這一次旅行中想了許多事情..
也讓自己心情轉換了一些..沒想到旅遊還挺不錯的 ^__^
我會慢慢補上相關的遊記..跟照片的..

2010年6月15日 星期二

[生活] 日本超市 Tokyo Fisher Market

日本超市 Tokyo Fisher Market


我覺得習慣真可怕
當自己忙到不能寫網誌後
考完試閒下來也就沒有繼續寫
果然習慣跟懶散都是大敵阿~~
最近暑假比較有空可以整理一下這邊的生活
這一篇就來說說日本魚市場吧

說起來這真的是加州的一大好處
在美國可不比台灣
可以那麼容易找到你想要的素材或食材
而這家日本超市雖然比較貴一點
但是卻有一些特別的日式食物
偷偷拍了一下內部的裝潢
還可以看到上面的冷凍兩個字

雖然小又貴,可是有些東西就只有這邊有賣
連冷凍的章魚燒都有賣 ($4.59 稅前 ) 真貴!


最後拍一下外面進來的地方,是一個古老的建築
第一次一直忽略這個點的說...

2010年5月14日 星期五

[學習] Matlab 基本指令

每次一段時間過後
要寫matlab指令又要再找一次
還是整理一下在這邊好了
基本中的基本:
  1. clc : 清除command....and error windows
  2. clear : 清除所有變數
  3. clf : 清除圖形
  1. mean(x)
  2. std(x)
  3. sort(x) 參考
  4. reshape(A,m,n) 參考
  5. size(a,2) 行 1->列

[學習]_Empirical distribution function

參考 http://en.wikipedia.org/wiki/Empirical_distribution_function

最近寫231報告的時候用到的
好像無母數分析裡面常常使用
當我們不確定資料的分布狀況時

給定一組資料
可以用cdf來逼近分布的狀況
就叫做empirical distribution

ps: Matlab 中相關的指令 given x is a set of data
ecdf(x)
cdfplot(x)
http://www.mathworks.com/access/helpdesk/help/toolbox/stats/ecdf.html
http://www.mathworks.com/access/helpdesk/help/toolbox/stats/cdfplot.html

2010年3月25日 星期四

[學習] Implicit function theorem

還有一個強大的定理 Implicit function theorem
基本上就是想知道 dy/dx 但是所有的關係都是透過另一個函數連在一起的
所以有人就很聰明的發展這個定理
就算兩個變數是沒有直接相關連的
我們也可以很快知道彼此對應的影響
推導的內容也只是用到簡單的chain rule而已
但是卻真的滿好用得
記錄一下

http://en.wikipedia.org/wiki/Implicit_function_theorem

[學習] Envelope theorem

記錄一下寫作業的時候用到的兩個定理:
Envelope theorem:
當面對 min f(x,r)
想知道單一變數偏微的效果時可以使用(以外為引用沒有限制的情況下)

Consider an arbitrary maximization (or minimization) problem where the objective function f(x,r) depends on some parameters r:

f^*(\bold r) = \max_{\bold x} f(\bold x,\bold r)\,

The function f *(r) is the problem's optimal-value function — it gives the maximized (or minimized) value of the objective function f(x,r)as a function of its parameters r.

Let x*(r) be the (arg max) value of x, expressed in terms of the parameters, that solves the optimisation problem, so that f*(r)=f(x*(r),r). The envelope theorem tells us how f*(r) changes as a parameter changes, namely:

\frac{d\ f^*(\bold r)}{d\ r_i} =  \frac{\partial f(\bold x,\bold r)}{ \partial r_i} \Bigg|_{\bold x = \bold x^*(\bold r)}

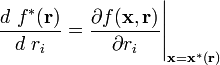
That is, the derivative of f*(r) with respect to ri is given by the partial derivative of f(x,r) with respect to ri, holding x fixed, and then evaluating at the optimal choice x=x*(r).

http://en.wikipedia.org/wiki/Envelope_theorem
應該是要求 f is twice differentiable continuous function.

2010年3月20日 星期六

[學習] NP hard & NPComplete

最近有人問什麼是NP 什麼是NPComplete
就順便查了一下清楚的定義
簡單的說,
NP hard的問題就是沒有辦法找到Polynomial的演算法來解決此問題
但是在NP hard的問題中又可以分成 NP Complete 跟 Weakly NP
原因是演算法複雜度包含了兩個部分
一個是演算法迭代的operation次數
一個是演算法的digits 次數
如果兩個都是NP的話,就是NP Complete
如果演算法是Polynomial的話,但是digit有可能會爆掉
就是weakly NP

參考:
http://en.wikipedia.org/wiki/Weakly_NP-complete
http://en.wikipedia.org/wiki/NP-complete

2010年3月18日 星期四

[研究] 興趣

最近在思索自己真正感興趣的方向是什麼
有些人可以很輕易找到自己喜歡的
我則是一直在思考這個問題
要找到有熱情的領域
因為影響深遠的一個決定

但是這個真的不是一個容易的決定
在思考的過程反反覆覆
還要兼顧自己的能力還有時機
總之要好好思考加油才行~~

2010年3月4日 星期四

[研究] Latex Editor

最近在用latex的時候想到朋友用的軟體可以即時顯示結果
所以就問了一下來試試看
畢竟Windet已經用了一段時間
找類似的軟體又可以提供所見即所得的效果較好
所以就試了這個 Latex Editor (LEd) http://www.latexeditor.org/index.html
他提供了內建的embedded dvi viewer
當compile成dvi後可以在旁邊看到編輯時的狀況
相對來說比之前全文書介面來的方便許多
唯一要注意的就是針對 Mitex 2.7要選正確的dll連接
還有看dvi重點的 Ghostscript 不能選太新的版本
我用最新的版本都看不到eps圖片
但是用 gs854w32.exe 就可以解決這個問題了
有興趣的朋友也可以參考看看

2010年2月19日 星期五

[遊記] Muir Woods National Monuments


因為薏棻的妹妹們過來這邊
由於他們自助多半都是在城市逛
我們就想說去戶外走走散心也不錯
這時候想起上學期Ellen說這邊有些國家公園不錯
就決定星期六的時候去國家公園走走

上網查了一下發現這個國家公園還滿近的
而且評價也還不錯就決定去了這個Muir Woods 國家公園
當天天氣還不錯,一路上風景也很好
一邊走一邊拍照,心情也開心了起來
每次開學就被行程還有計畫壓的累死了
真的需要轉移一下注意力

還記得在ohio的時候還可以常常照相
不知不覺就可以抒解壓力
這邊一個不小心就弄作業弄不完了...
還是要多照照相才行...這次照相的時候都有一點生疏快門光圈設定了
我們在入口的地方照相
走在步道上,真的有進入森林的感覺
真的很難想像這邊之前原本是沒有樹木的


一開始還一邊走一邊看路線,入口處隨便照了一張
剛好是山谷中陽光從上面照下來的樣子,
感覺有一種老天爺給予的恩澤照下來的感覺(好啦...應該是我想太多了)
還有大大的年輪跟高高的樹木
魔戒裡面的樹人應該就是這樣高大的吧
如果它忽然動起來我應該會很害怕~~
走一走會覺得自己好渺小喔
面對大自然的時候,人類的渺小就自然地顯露了
很多煩惱也因為這樣一趟而散開了許多 (雖然之後趕作業時又回來了)


去一個地方重要的是什麼呢?
當然是gift shop阿~~
到了 gift shop時外面有好幾隻大大的熊...
讓我想到黃金羅盤裡面小孩子騎熊的樣子...嘿嘿嘿
就給他騎上去了~~看起來還有模有樣的


總歸來說,這是個讓人散心的好地方~~
希望新的一年
生活可以不要那麼忙碌
有機會多多散散心走一走~~

[統計] PK formula (Pollaczek–Khinchine formula)

cite: http://en.wikipedia.org/wiki/Pollaczek%E2%80%93Khinchine_formula

PK formula for M/G/1 queue
可以看到只要moment fitted
我們就可以預期得到一樣的 long term waiting time
不過問題是
我們怎麼知道真實世界的moment是怎樣呢?

Pollaczek–Khinchine formula

From Wikipedia, the free encyclopedia

Jump to: navigation, search

The Pollaczek-Khinchine formula is used in queuing theory to determine the mean time spent waiting in the queue to be serviced (the queuing delay) and the mean end-to-end time through the system. The formula is applicable in a single server situation with arrivals distributed according to a Poisson distribution and a general service time distribution. [Known as a M/G/1 system in Kendall's notation.] The formula was developed by Felix Pollaczek and Aleksandr Khinchin.

[edit] Formula

The formula states that the mean queuing delay is given by:
F_q=\frac{1}{\lambda_s}\times \frac{\rho}{1-\rho}\times\frac{1+C_s^2}{2}
The average time in the system, F, is given by:
F=F_q+\frac{1}{\lambda_s}
In the above equations, the variables are defined as:
λs=rate of service
λa=rate of arrival
\rho=\frac{\lambda_a}{\lambda_s}, which is called "traffic intensity," ranges between 0 and 1, and is the mean fraction of time that the server is busy. [If the arrival rate λa is greater than or equal to the service rate λs, the queuing delay becomes infinite.]
Cs is the coefficient of variation of the service time (the ratio of its standard deviation to its mean). This equals σsλs, where σs is the standard deviation of the service time, as the mean service time is 1/λs. Cs = 0 when service times are constant, and Cs = 1 when service times follow an Exponential distribution.

[edit] Examples

If ρ equals 0.5, that is the server is busy 50% of the time, and Cs = 1, then
F_q=\frac{1}{\lambda_s}\times \frac{\rho}{1-\rho}\times\frac{1+C_s^2}{2}
F_q=\frac{1}{\lambda_s}\times \frac{0.5}{0.5}\times\frac{1+1}{2}
F_q=\frac{1}{\lambda_s}
That is, when the server is busy only half the time, the mean queuing time equals the mean service time. That may help explain the long wait at the post office!

As ρ increases, the mean queuing time increases rapidly. If the server is 90% utilized, then the mean queuing delay is nine times the mean service time.

Note that, if the service time is always the same (Cs = 0), then the mean queuing delay is half what it would be if the service time were exponentially distributed (Cs = 1).

[統計] Beta distribution

Beta distribution是最常用的一個分配
我們看到的一般是
General beta (α,β,min, max)
前面兩個是shape parameters 後面兩個是 range parameters

其他相關的可以參考wiki連結
http://en.wikipedia.org/wiki/Beta_distribution

[轉錄] Histogram 製作方法

實用參考連結。

Creating a Histogram in Excel

Sales Forecast Example - Part III

In Part II of this Monte Carlo Simulation example, we completed the actual simulation. (If you haven't already, Download the example spreadsheet). We ended up with a column of 5000 possible values (observations) for our single response variable, profit. The last step is to analyze the results. We will start off by creating a histogram in Excel, a graphical method for visualizing the results.

We can glean a lot of information from this histogram:

  • It looks like profit will be positive, most of the time.
  • The uncertainty is quite large, varying between -1000 to 3400.
  • The distribution does not look like a perfect Normal distribution.
  • There doesn't appear to be outliers, truncation, multiple modes, etc.

The histogram tells a good story, but in many cases, we want to estimate the probability of being below or above some value, or between a set of specification limits.

Creating a Histogram in Excel

Method 1: Using the Histogram Tool in the Analysis Tool-Pak.

This is probably the easiest method, but you have to re-run the tool each to you do a new simulation. AND, you still need to create an array of bins (which will be discussed below).

Method 2: Using the FREQUENCY function in Excel.

This is the method used in the spreadsheet for the sales forecast example. One of the reasons I like this method is that you can make the histogram dynamic, meaning that every time you re-run the MC simulation, the chart will automatically update. This is how you do it:

Step 1: Create an array of bins

The figure below shows how to easily create a dynamic array of bins. This is a basic technique for creating an array of N evenly spaced numbers.

To create the dynamic array, enter the following formulas:
B6 = $B$2
B7 = B6+($B$3-$B$2)/5
Then, copy cell B7 down to B11

Array of Bins in Excel
Figure 2: A dynamic array of 5 bins.

After you create the array of bins, you can go ahead and use the Histogram tool, or you can proceed with the next step.

Step 2: Use Excel's FREQUENCY formula

The next figure is a screen shot from the example Monte Carlo simulation. I'm not going to explain the FREQUENCY function in detail since you can look it up in the Excel's help file. But, one thing to remember is that it is an array function, and after you enter the formula, you will need to press Ctrl+Shift+Enter. Note that the simulation results (Profit) are in column G and there are 5000 data points ( Points: J5=COUNT(G:G) ).

The Formula for the Count column:
FREQUENCY(data_array,bins_array)

a) Select cells J8:J48
b) Enter the array formula: {=FREQUENCY(G:G,I8:I48)}
c) Press Ctrl+Shift+Enter

Layout for Creating a Scaled Histogram
Figure 3: Layout in Excel for Creating a Dynamic Scaled Histogram.

Creating a Scaled Histogram

If you want to compare your histogram with a probability distribution, you will need to scale the histogram so that the area under the curve is equal to 1 (one of the properties of probability distributions). Histograms normally include the count of the data points that fall into each bin on the y-axis, but after scaling, the y-axis will be the frequency (a not-so-easy-to-interpret number that in all practicality you can just not worry about). The frequency doesn't represent probability!

To scale the histogram, use the following method:
Scaled = (Count/Points) / (BinSize)

a) K8 = (J8/$J$5)/($I$9-$I$8)
b) Copy cell K8 down to K48
c) Press F9 to force a recalculation (may take a while)

Step 3: Create the Histogram Chart

Bar Chart, Line Chart, or Area Chart:

To create the histogram, just create a bar chart using the Bins column for the Labels and the Count or Scaled column as the Values. Tip: To reduce the spacing between the bars, right-click on the bars and select "Format Data Series...". Then go to the Options tab and reduce the Gap. Figure 1 above was created this way.

A More Flexible Histogram Chart

One of the problems with using bar charts and area charts is that the numbers on the x-axis is actually just labels. This can make it very difficult to overlay data that uses a different number of points or to show the proper scale when bins are not all the same size. However, you CAN use a scatter plot to create a histogram. After creating a line using the Bins column for the X Values and Count or Scaled column for the Y Values, add Y Error Bars to the line that extend down to the x-axis (by setting the Percentage to 100%). You can right-click on these error bars to change the line widths, color, etc.

Histogram Via Error Bars

2010年2月13日 星期六

Authorization Only Transaction

Authorization Only (Auth Only) is a special type of sale transaction. It authorizes an amount on a customers card but the item does not settle until a later time, sometime several days or weeks.
授權交易是一種特別的交易,他授權店家在一段時間內保留一筆金額在信用卡內,等到通常幾天或幾個星期後才真正的扣款或取消。

The purpose of an authorization only transaction is to reserve an amount against a card holder's available credit limit for a certain period of time.
此交易的目的是為了在消費者信用額度內保留一定的金額,已確保未來能夠支付此消費。

For example, a merchant may perform an authorize only transaction if an item ordered is out of stock. Then when the item is in stock, the merchant will then settle the transaction, essentially charge the card at that time.
例如,如果一個東西缺貨中,店家可以先產生一筆授權交易,等到貨物到了以後再扣款。

Another reason a merchant may do an authorization only transaction is when the exact amount to be charged to a card is not know. This is often used in the hotel industry. When a patron checks in to a hotel, their card is authorized for an amount greater than the length of their stay. However, the transaction is not settled until check out, where the hotel may include any incidentals you may want to charge to your room. At checkout the hotel enters the actual final amount and then settles the transaction and the card is charged.
另一個情況是,當你購買東西的時候還不知道應該花費多少時,店家會先保留一部份較高的金額在你信用卡中,等到你真正消費後才扣款。例如當你進入旅館時,在check in櫃臺,他會先扣一筆高於你應該要付的錢,這部份包含了一些你可能產生的消費額度,等到真正要離開時,如果沒有那一筆消費他就會退錢給你。

One caveat is that if an authorization only transaction is not settled within 24 hours, then the transaction can downgrade to a different rate category and the merchant may be surcharged a small fee. However, the benefits of using an authorization only transaction by a merchant usually outweigh any additional costs involved, since by doing the authorization the merchant is still guaranteed payment.
要注意的是:如果授權消費沒有在24小時內結算,該交易可能會要多產生一筆手續費。但是就算有手續費,他的好處就是能夠確保消費者有能力支付此項目,所以還是很常在生活上看到。

[心情] 說一下這邊的學習

最近跟朋友討論
為什麼老師都教基本的定義
就要大家去做更進階的問題
這在台灣一定會造成反應
但是在這邊卻好像是理所當然的

雖然有老師會被反應教的沒有組織
但是很多課程都幾乎沒有特定的課本
上課就是一堆課本的綜合
特別辛苦

討論後才發現
這可能也需要配套的選擇學生吧
因為這邊的學生都能夠自己從課本上學
所以老師的目的是把大家的眼界提升到最新的研究上面
基礎的部分只教定義
然後題目出得很困難
讓學生知道自己的不足後
就會把那一塊補起來了
老師都會把重心放在最新的研究
或是把大家提升到問題的更核心的部分


總覺得這樣老師真的很有風險
因為學生很有可能就會說老師教的不好
但是老實說
這邊的教育真的比台灣紮實很多
基本上修三門四門課已經是極限了
上課教了基本的東西後
作業可以要你寫程式來模擬
可以要你做更進一步的證明
可以給open ended question讓你自己去發覺問題
自己去提出質疑並且嘗試解答
這樣的能力對於教育本質來說更符合常規
卻是台灣教育所忽視的

stop asking problem before you thought it through~

2010年1月20日 星期三

[心情] 緊張的一個學期

這幾天一直在想修課還有時間的問題
可是排了進度才發現根本時間不夠用
這學期期末就要考資格考
雖然科目上學期有學過
但是考的問題都是比上課教還要困難的問題
還要練習講述清楚解題思路還有方式
要練習的東西真多
要好好抓時間這學期
這幾天自從回來後一直有時差
現在調整到晚上九點左右睡然後五六點起床
希望能夠保持下去這樣的生活
畢竟頭腦清楚的一天是很不錯的
再來就是交通還有零碎時間怎樣掌握了
既然放棄了錢的機會
就要好好地準備考過這個考試~~
加油~~